Back to Work Archive
◈ ፪
CASE STUDY 0b9431663-bcfa-4209-bd5f-8b621b040081Investiment Dashboard UI
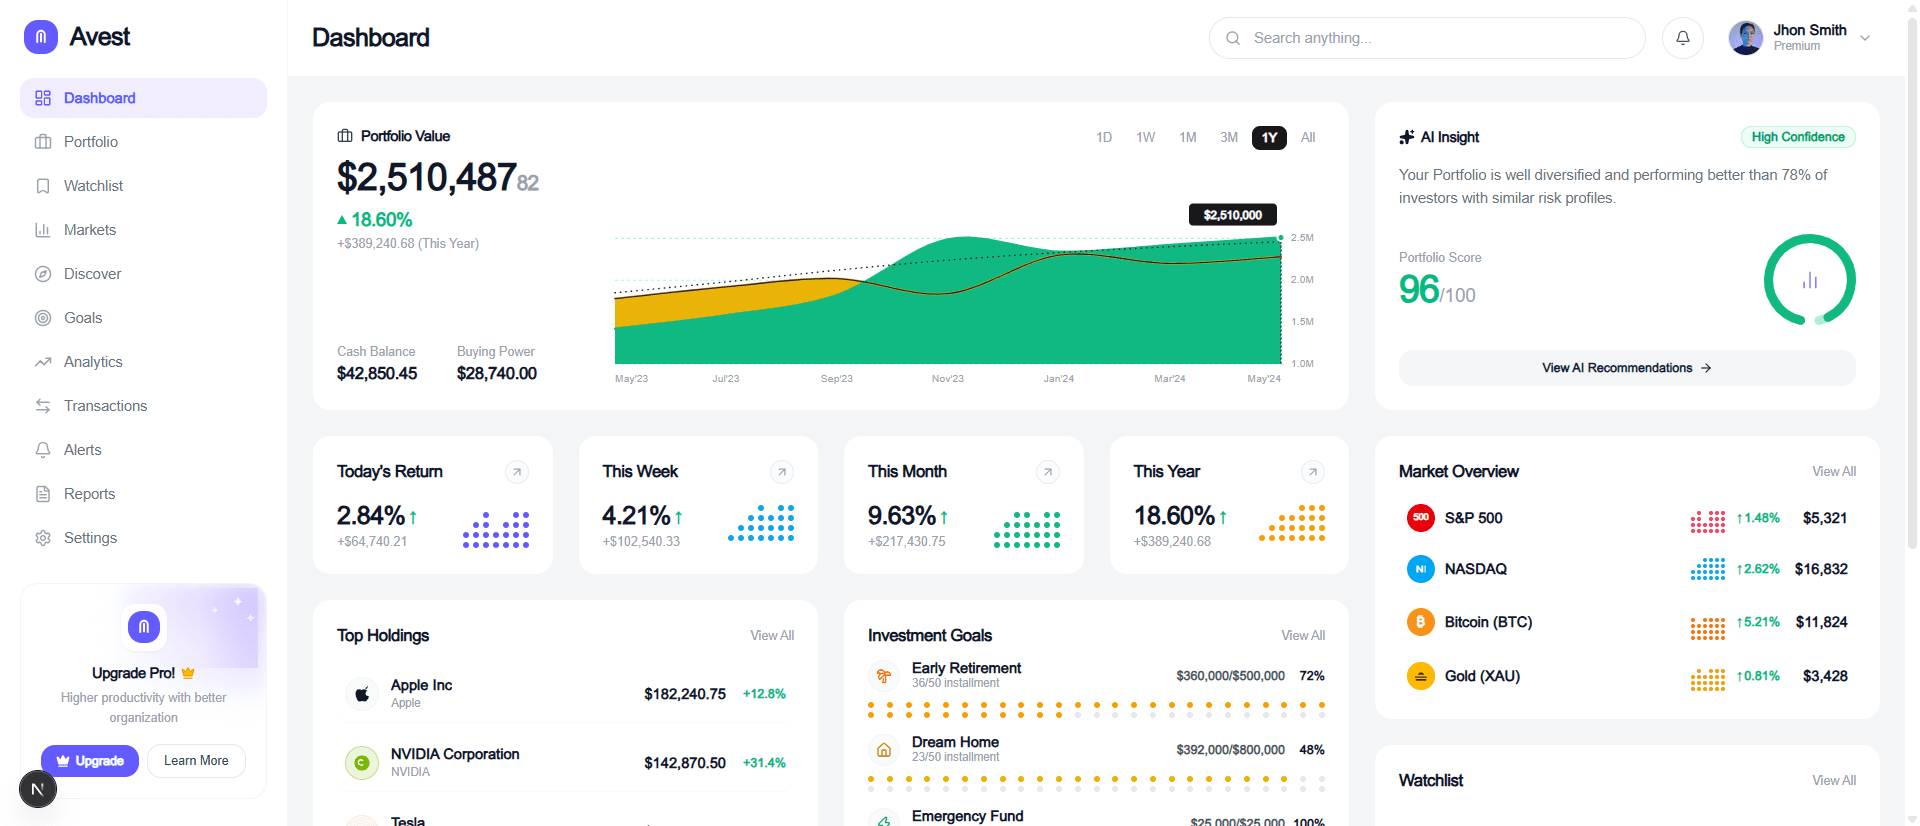
A clean, data-rich portfolio tracking dashboard with AI-powered insights
ROLESole frontend developer and UI designer: layout and visual design, component architecture, chart integration, responsive behavior and styling.
TIMELINE2 weeks
DOMAINFullstack
LINKS
፩THE CHALLENGE
The Problem Space
Most investment dashboards are crowded and hard to read. Users struggle to see total value, performance and goal progress at a glance. The challenge was to show a lot of data without overwhelming the user.
፪SYSTEM ARCHITECTURE
Technologies & Tools
Next.jsReact.jsTypescript RechartTailwind csssResponsive ui design
Architectural Highlights
- Component-based structure: cards, stat tiles, list rows and chart wrappers are reusable
- Layout built on CSS grid and flexbox, with a fixed sidebar and a scrollable content area
- Data separated from presentation through mock data objects, so a real API can be connected later
- Consistent semantic colors: green for gains, orange or yellow for pending, purple for brand
፫ENGINEERING CHOICES
Key Architectural Decisions
DECISION 01
Frontend-only scope with mock data, to focus on design quality and component structure
Dense data on one screen: solved with generous spacing, clear typographic scale and grouped cards
፬OBSTACLES & RESOLUTION
Challenges Faced
፭VERIFIED OUTCOMES
Results & Deliverables
NEXT CASE STUDYAi Mentor Plus
Read Next Case Study